Prototype Timelines by the Numbers: Design, Printing and Testing
Where the time goes in a prototyping project, and how to chart it
When you develop a new part or product, time is usually the figure everyone asks about first. How long will the design take? How many prototypes will we need? When can we have something to test? Breaking a prototyping project into a few measurable stages makes those questions easier to answer, and charting them across projects shows where the time really goes.
Stage 1: design
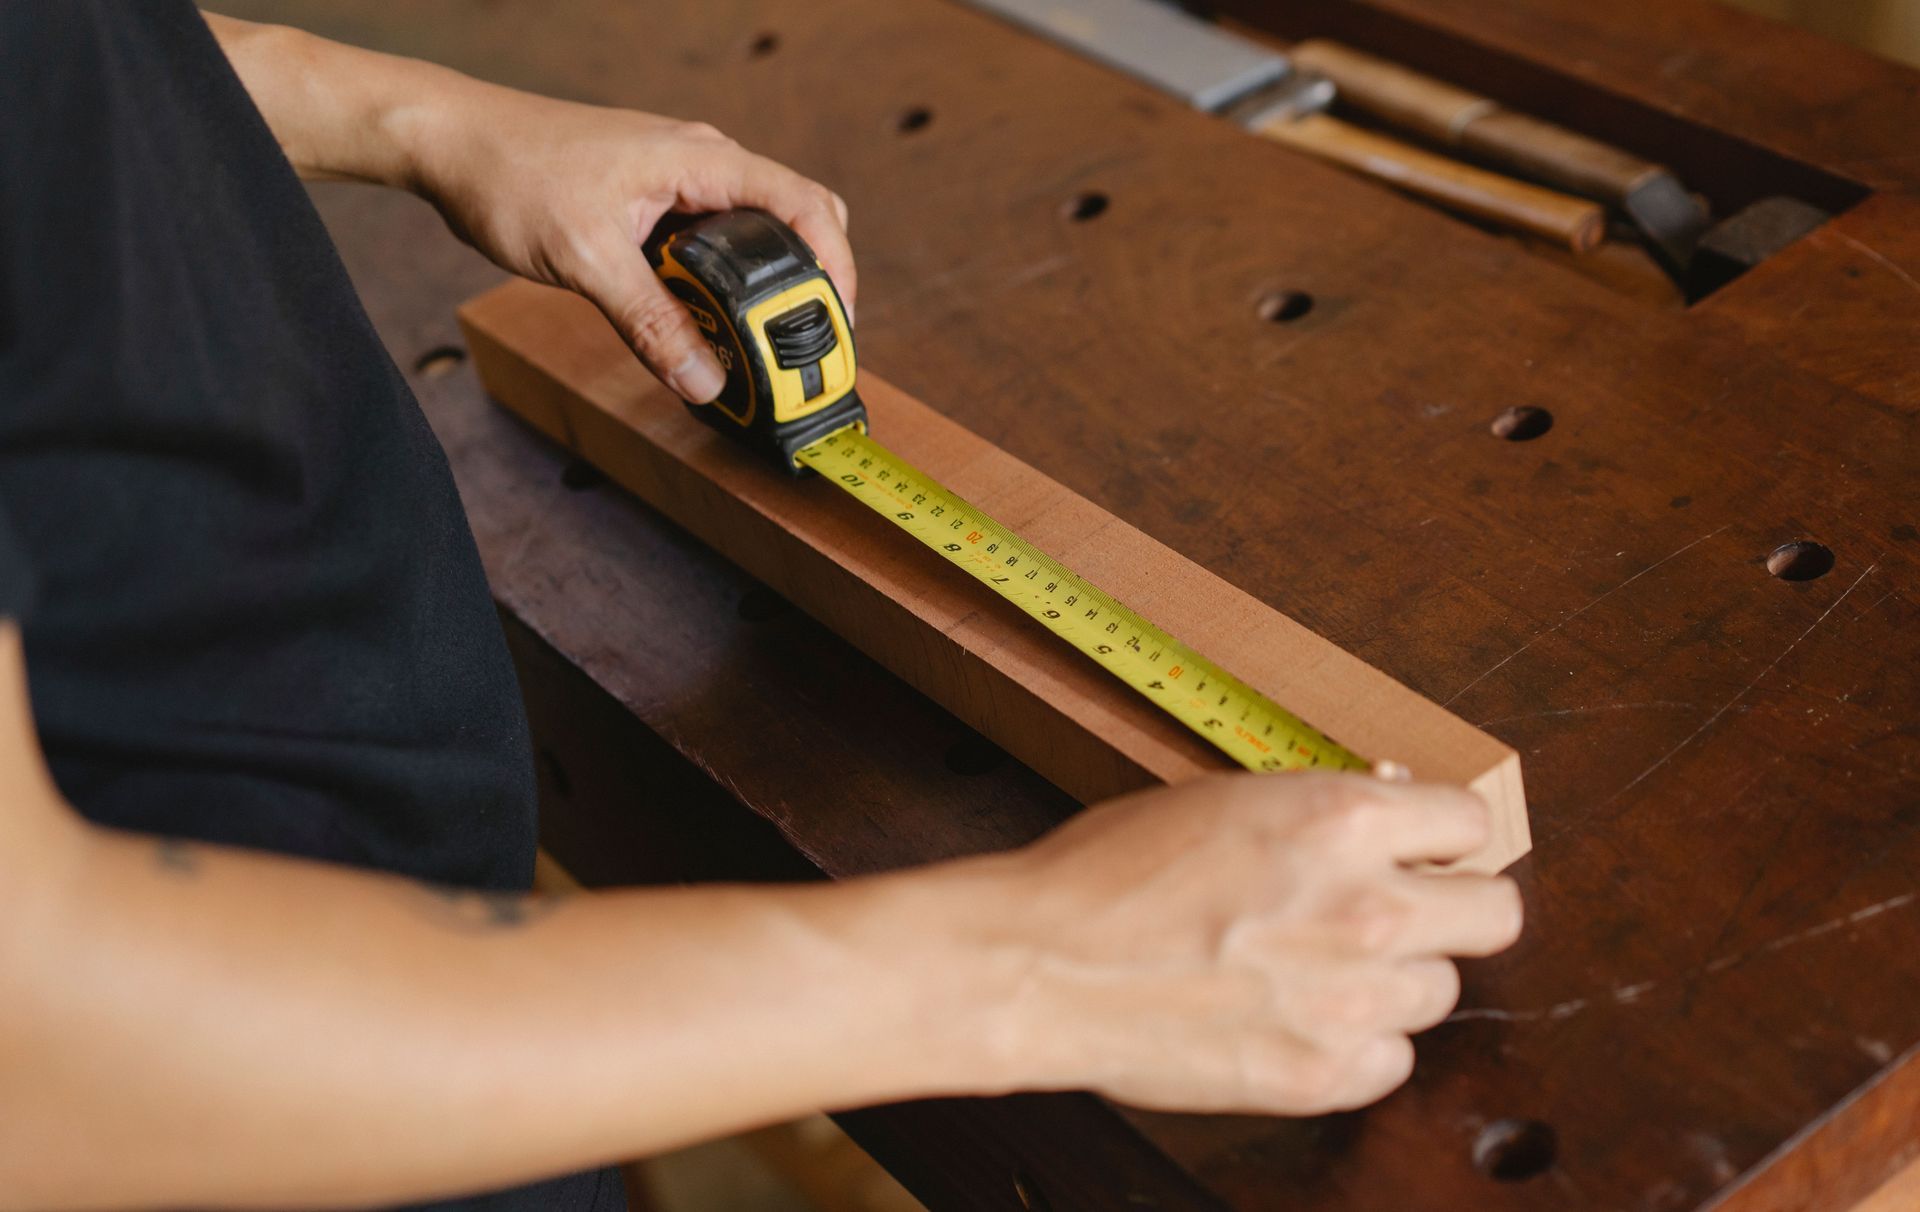
If you already have an STL file, this stage may be short. If you are starting from a sketch, a 2D drawing or an existing item, the design time depends on how complex the part is and how many features need measuring. Working with a 3D modelling service that builds a visual model for you to approve means problems are spotted before any material is used.
- Simple parts: a bracket, clip or cover may need only a short design stage
- Moderate parts: parts with moving features, threads or several mating surfaces take longer
- Complex assemblies: multi-part products need the most design time and the most checking
Stage 2: printing
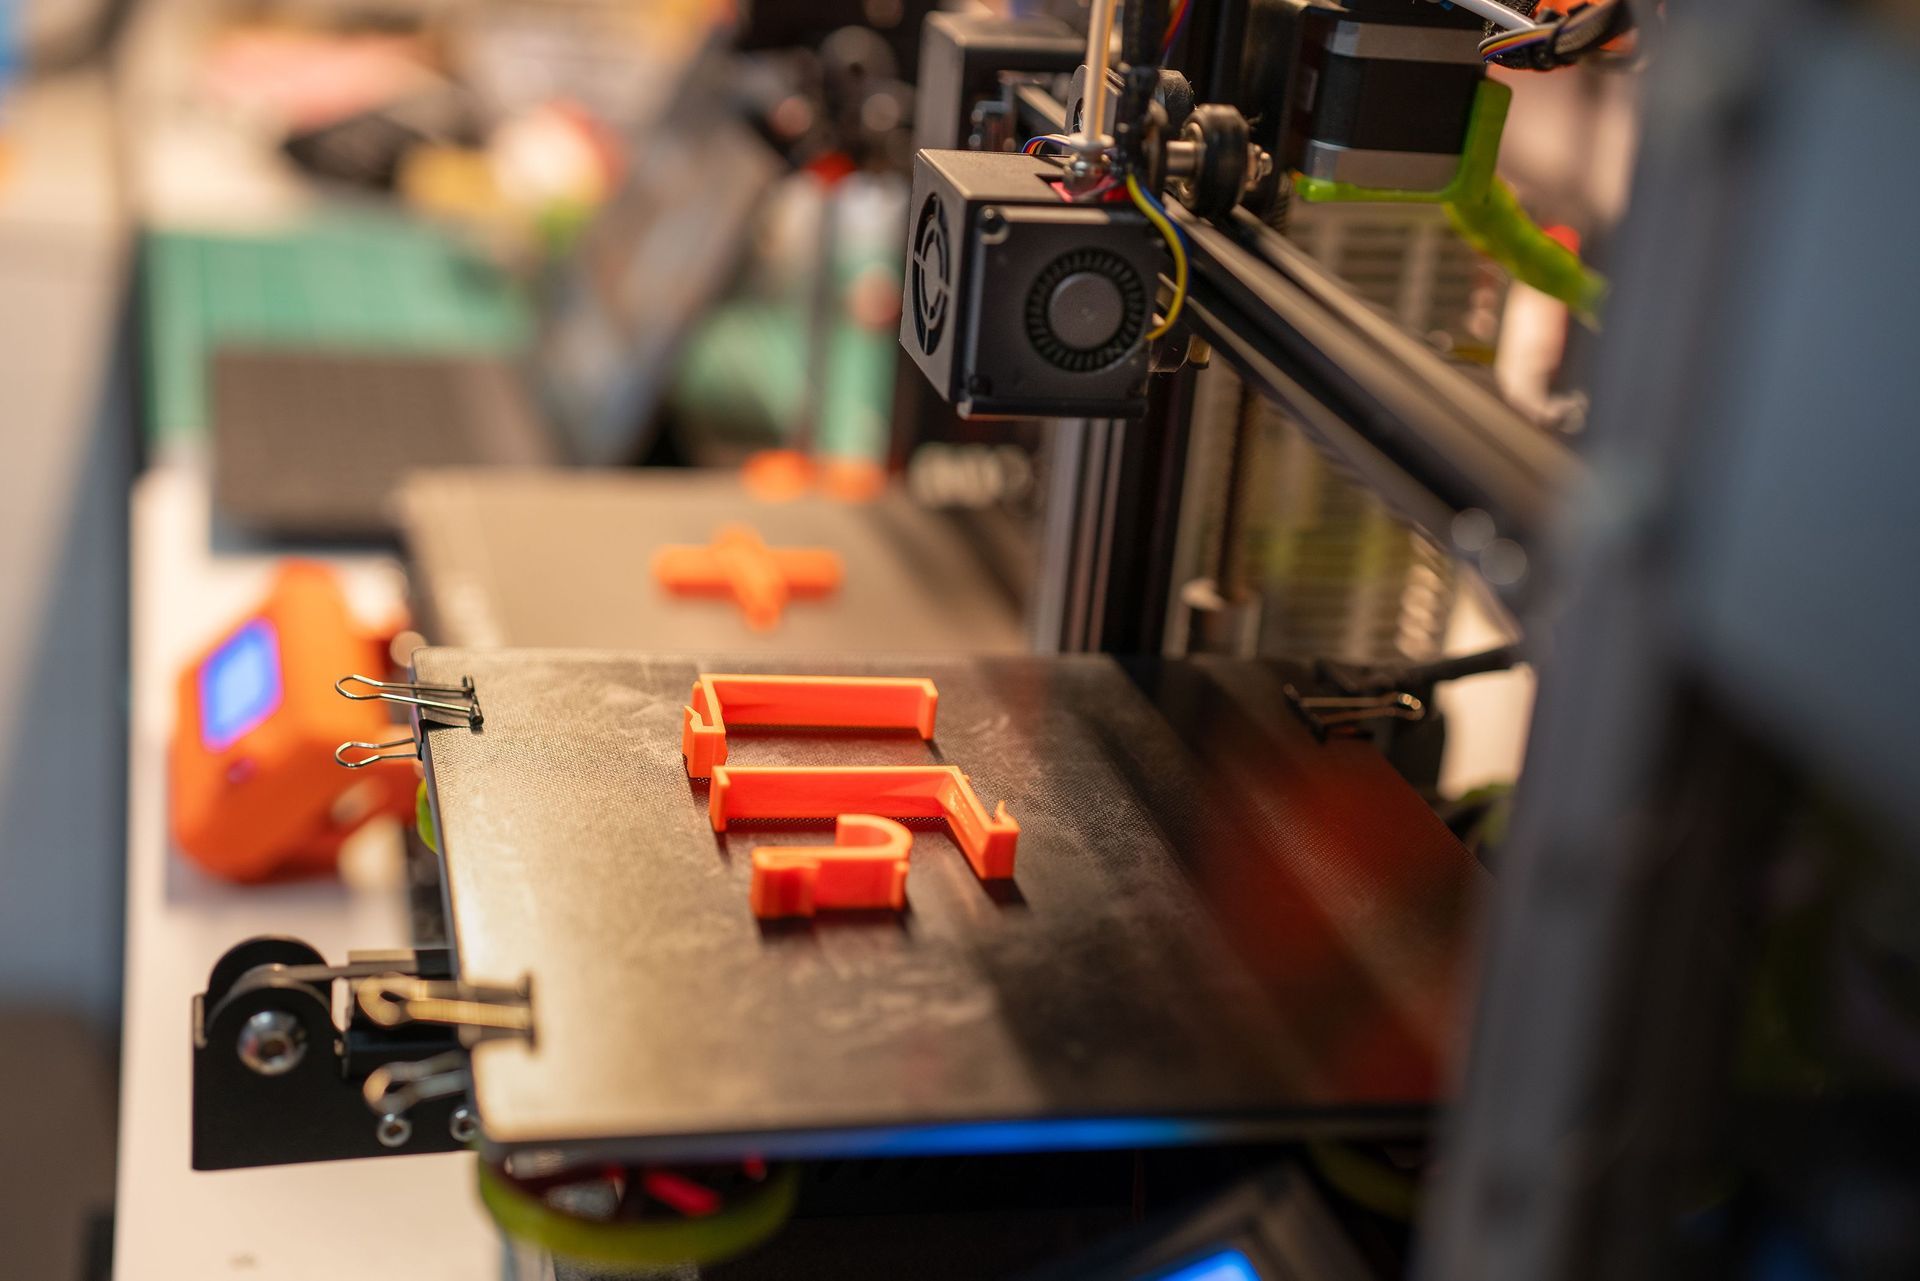
Print time depends on size, detail and material. Many printers work within a build area of about a shoebox, so larger parts are printed in sections and assembled, which adds time. Printing several prototypes in one run saves time overall, because a single print can produce copies for fit, function and destructive testing at once.
Stage 3: testing and revisions
Each round of testing usually leads to some changes, and each change means another update to the CAD model and another print. The number of rounds is often the biggest factor in the total timeline.
Typical overall timelines
- About 1 week: simple designs from concept to delivered prototype
- Up to 6 weeks: complex projects with several rounds of design and testing
- Longer: very advanced designs, where rushing is a false economy
These are the kinds of figures quoted for prototype engineering in the East Midlands, and they make a useful benchmark when planning your own project.
Four figures worth charting
- Days per design round: from an approved change to a printed part in hand.
- Rounds per project: how many versions were needed before sign-off.
- First-time fit rate: the share of prototypes that fitted without changes.
- Design versus print time: where most of each project's time went.
Over a few projects, these charts show whether time is being lost in design, printing or testing, and help set realistic deadlines for the next one. For more on charting manufacturing and 3D printing, see our manufacturing category.
More Posts, Facts, Tools & Charts